Data analyst who builds, not just analyzes
I completed a 7-month intensive program in Python, SQL, and Power BI at Najot Ta'lim, and I am currently studying Business Information Systems at Westminster University in Tashkent (expected 2027).
My projects go beyond toy datasets — I built a live, self-updating ETL pipeline pulling real job market data from the Adzuna API across the UK and US, automated end-to-end with GitHub Actions and deployed as a public Streamlit dashboard, and created a full star-schema BI dashboard across 269,720 retail transactions.
Two years of e-commerce experience at Rizesport.uz gave me real business context: I know what questions managers actually need answered from data.
Projects
Five end-to-end projects — every line of code written and understood.
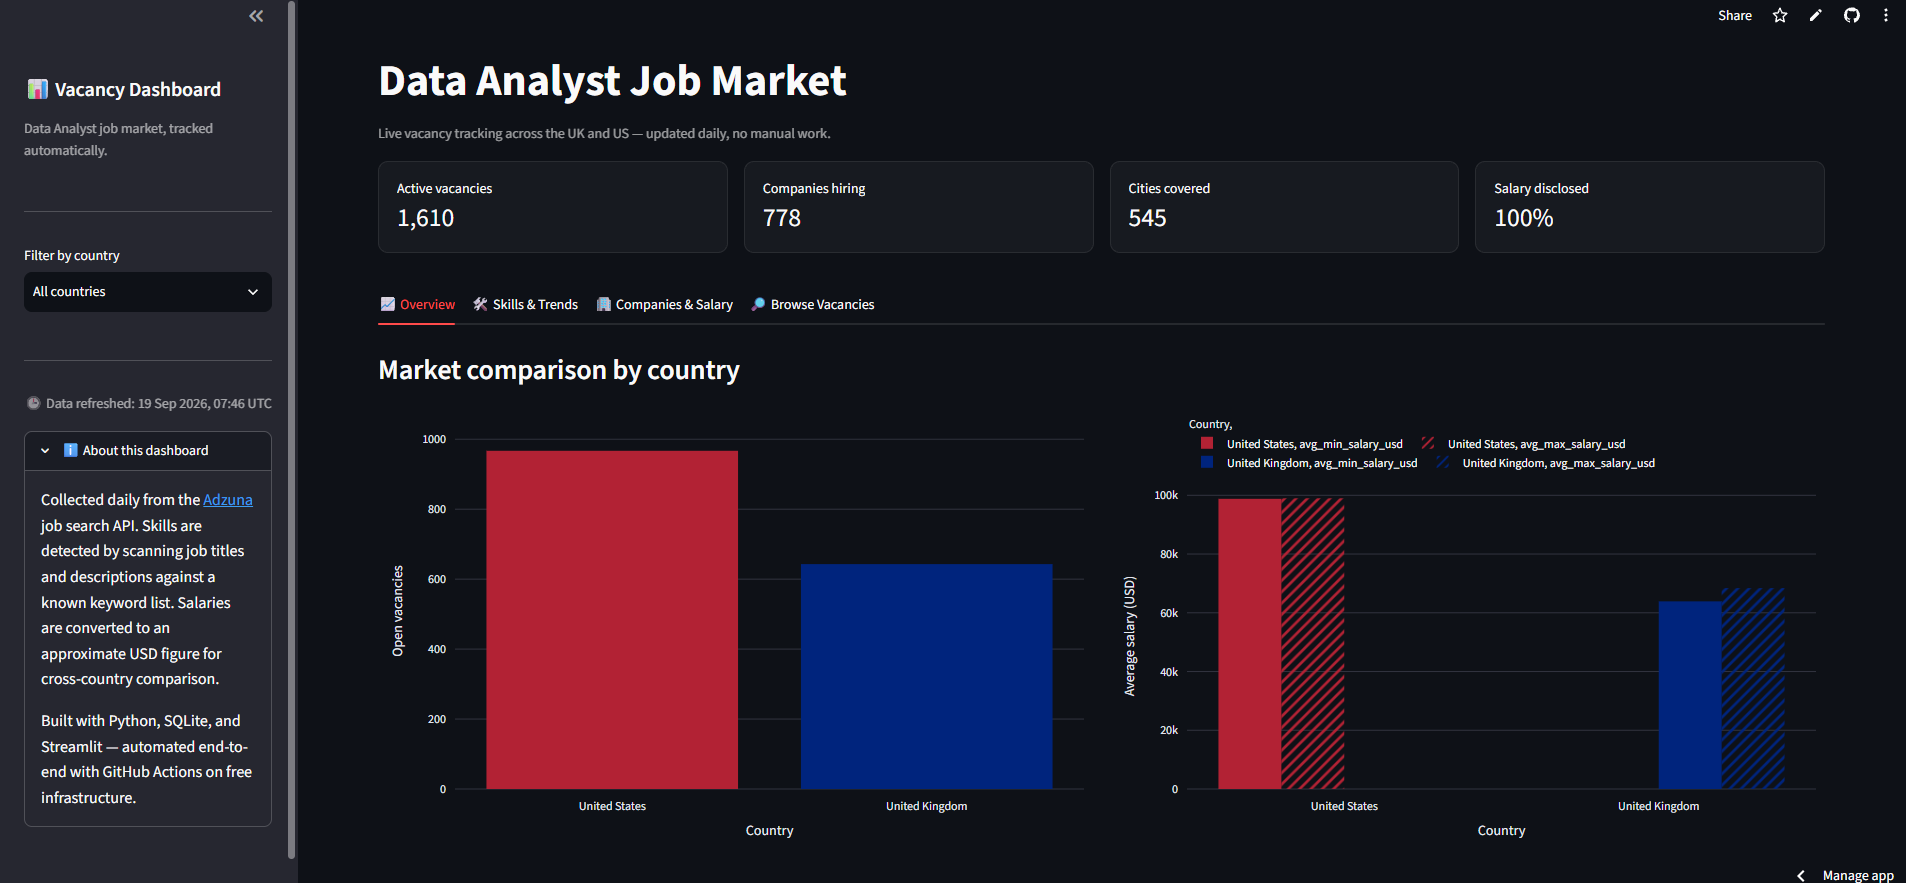 ETL · API · Streamlit
Live, self-updating dashboard tracking Data Analyst vacancies across the UK and US. Automated end-to-end with GitHub Actions, collecting 6,800+ postings via the Adzuna API.
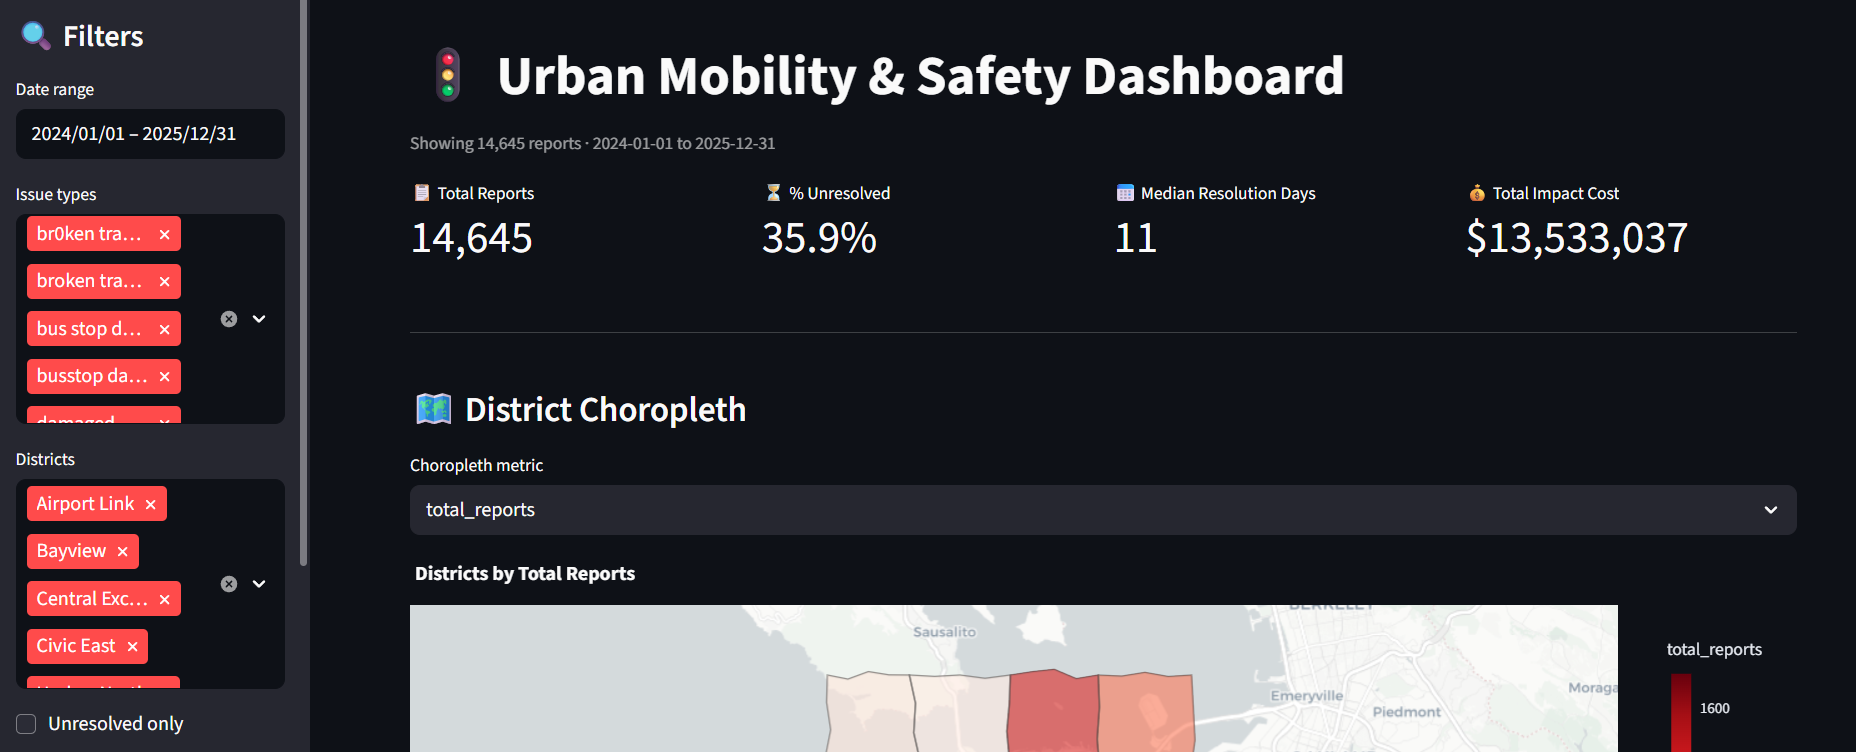 Streamlit · Live App
Interactive Streamlit dashboard analyzing 22,000+ urban safety reports. Full data wrangling pipeline with spatial joins.
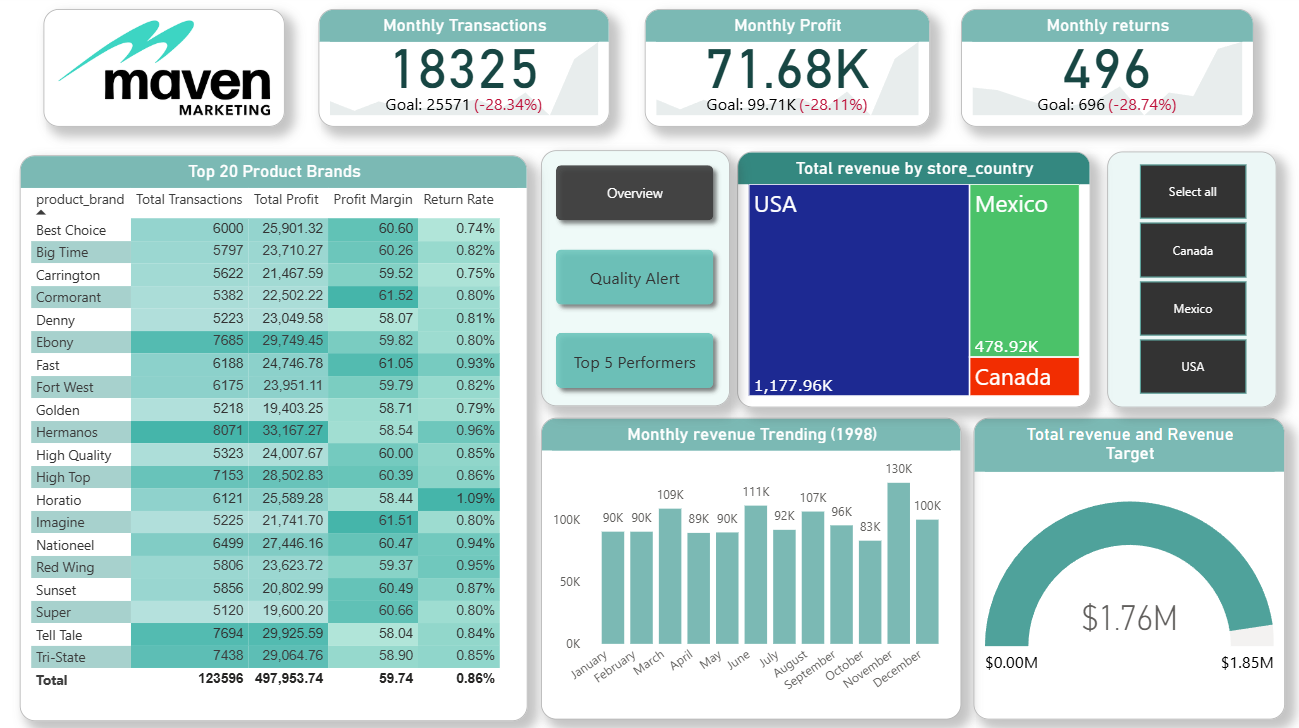 Power BI · DAX
Business intelligence dashboard across 269,720 transactions for a multi-national grocery chain. Star schema across 7 tables.
 EDA · Statistics
Statistical analysis of 891 Titanic passengers uncovering survival patterns. Chi-square tests and t-tests validated findings.
What I work with
Tools and technologies used across real projects — not just listed, actually applied.
Let's work together
I'm actively looking for junior Data Analyst roles. If you have an opportunity or just want to talk data — reach out.